I chart every bullpen my pitchers throw. Not because I love clipboards, but because my memory of a pen is wrong about half the time. The kid who looked sharp threw 48% strikes. The kid who looked off was missing by two inches, all to the glove side. The chart settles it.
What to record
Three things, every pitch.
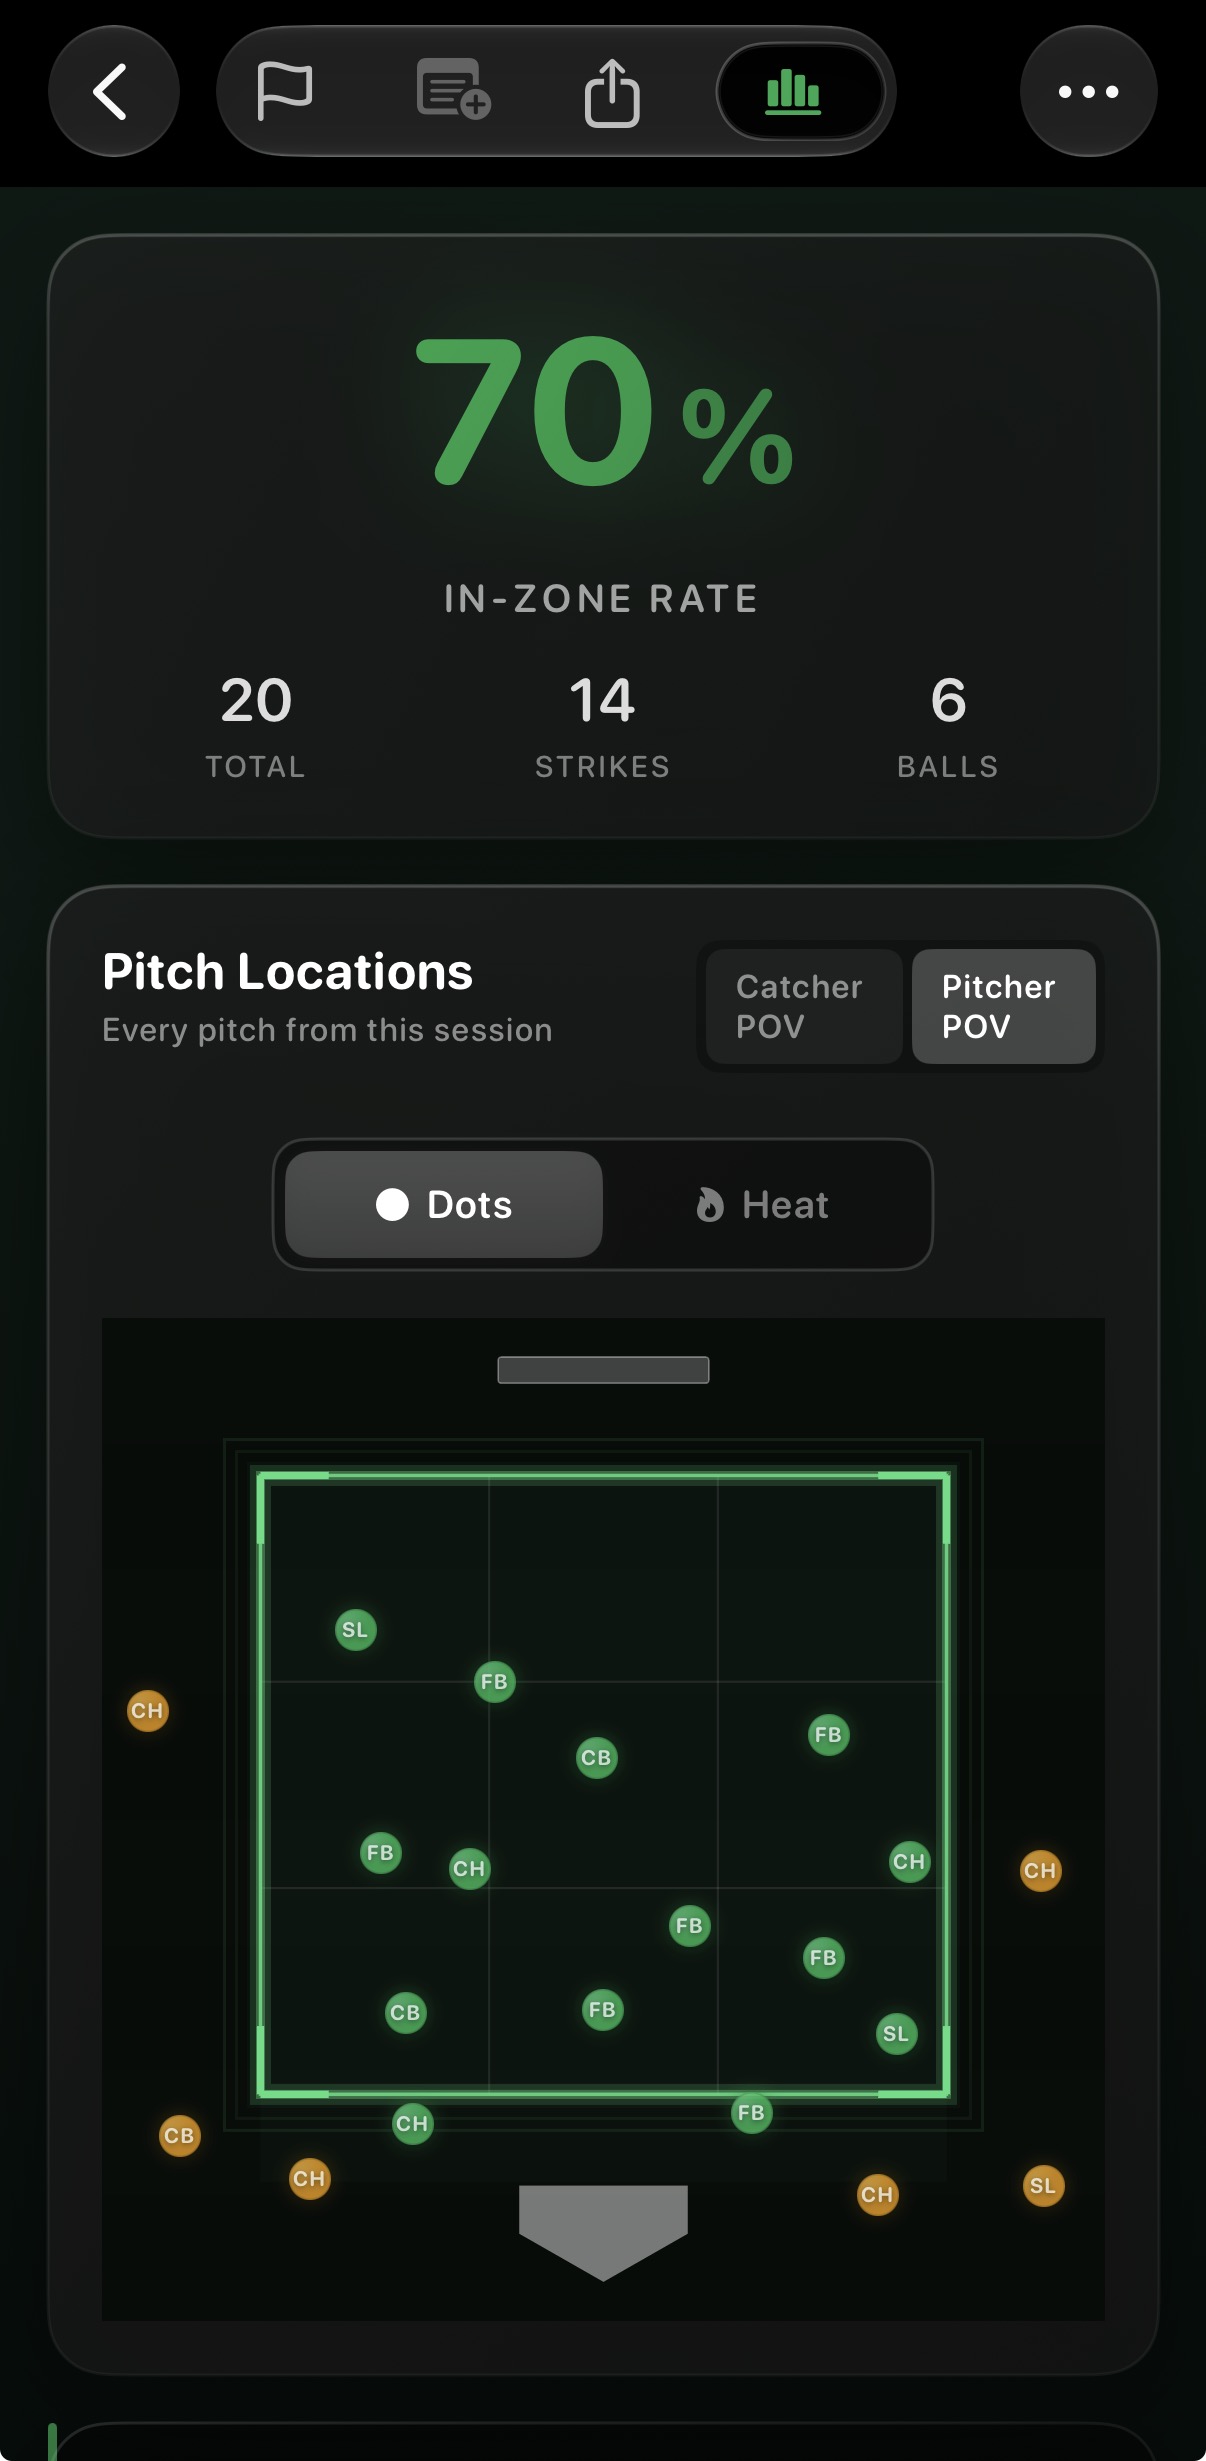
- Location. Where it crossed, in or out of the zone. A 3x3 strike zone with a ring of ball zones around it is enough. You don't need inches.
- Result. Strike or ball. In a pen, a strike is a pitch in the zone. Keep it that simple so two coaches chart the same way.
- Pitch type. Fastball, changeup, breaking ball. Without it, a 60% day can hide a fastball at 75% and a curveball at 30%.
Add a note when something jumps out: the arm slot dropped, the landing foot drifted, the pitcher said something felt tight. One line is plenty.
How many pitches
For most high school pitchers, 25 to 40 pitches is a good working pen. Younger kids throw fewer. Script it before they start: say 10 fastballs to the glove side, 10 to the arm side, 10 changeups, a few breaking balls, then a short at-bat sequence to finish. Scripted pens are easier to compare week to week, because the pitcher is working on the same things each time.
Count every pen against the arm. It is not a game pitch count, but it is work, and it belongs next to game pitches when you plan the week. If you are not sure how much rest a pitch count needs, the pitch count calculator has the Pitch Smart numbers.
What to look for over a month
One pen is a snapshot. Four weeks of pens is a trend, and the trend is what you coach from.
- Strike percentage trend. Is it climbing, flat or sliding? A pitcher who goes from 52% to 61% over a month is getting better, even if today was a bad day. More on the numbers in what is a good strike percentage.
- Misses by side. Most pitchers miss one way. If 70% of the misses are arm side and up, that is a mechanical fix, not a "throw more strikes" talk.
- Fatigue late. Split each pen into a first half and a second half. If strikes drop ten points in the back half every time, the pen is too long or the pitcher needs conditioning. It also shows you roughly where that pitcher will start to fade in a game.
One pen versus ten
A first bullpen tells you almost nothing about how good a pitcher is. It tells you where to start: which pitch they trust, which side they miss to, how they handle being watched. Don't change anything big off one pen.
Ten pens tell you who the pitcher is. You see the real strike percentage, not the best day or the worst. You see whether the adjustment you made in week two stuck. And you can show the kid the chart, which does more than any speech I can give.
Paper or an app
Paper works. I charted on paper for years, and a clipboard with a printed zone grid costs nothing and never needs a charge. The problem is what happens after the pen. The sheets pile up, nobody adds them up, and a month of data sits in a binder you never open. An app does the adding for you: strike percentage, misses by side, first half against second half, the trend across every pen. If you will really total the paper sheets every week, paper is fine. Most of us won't.
How it looks in PitchWise
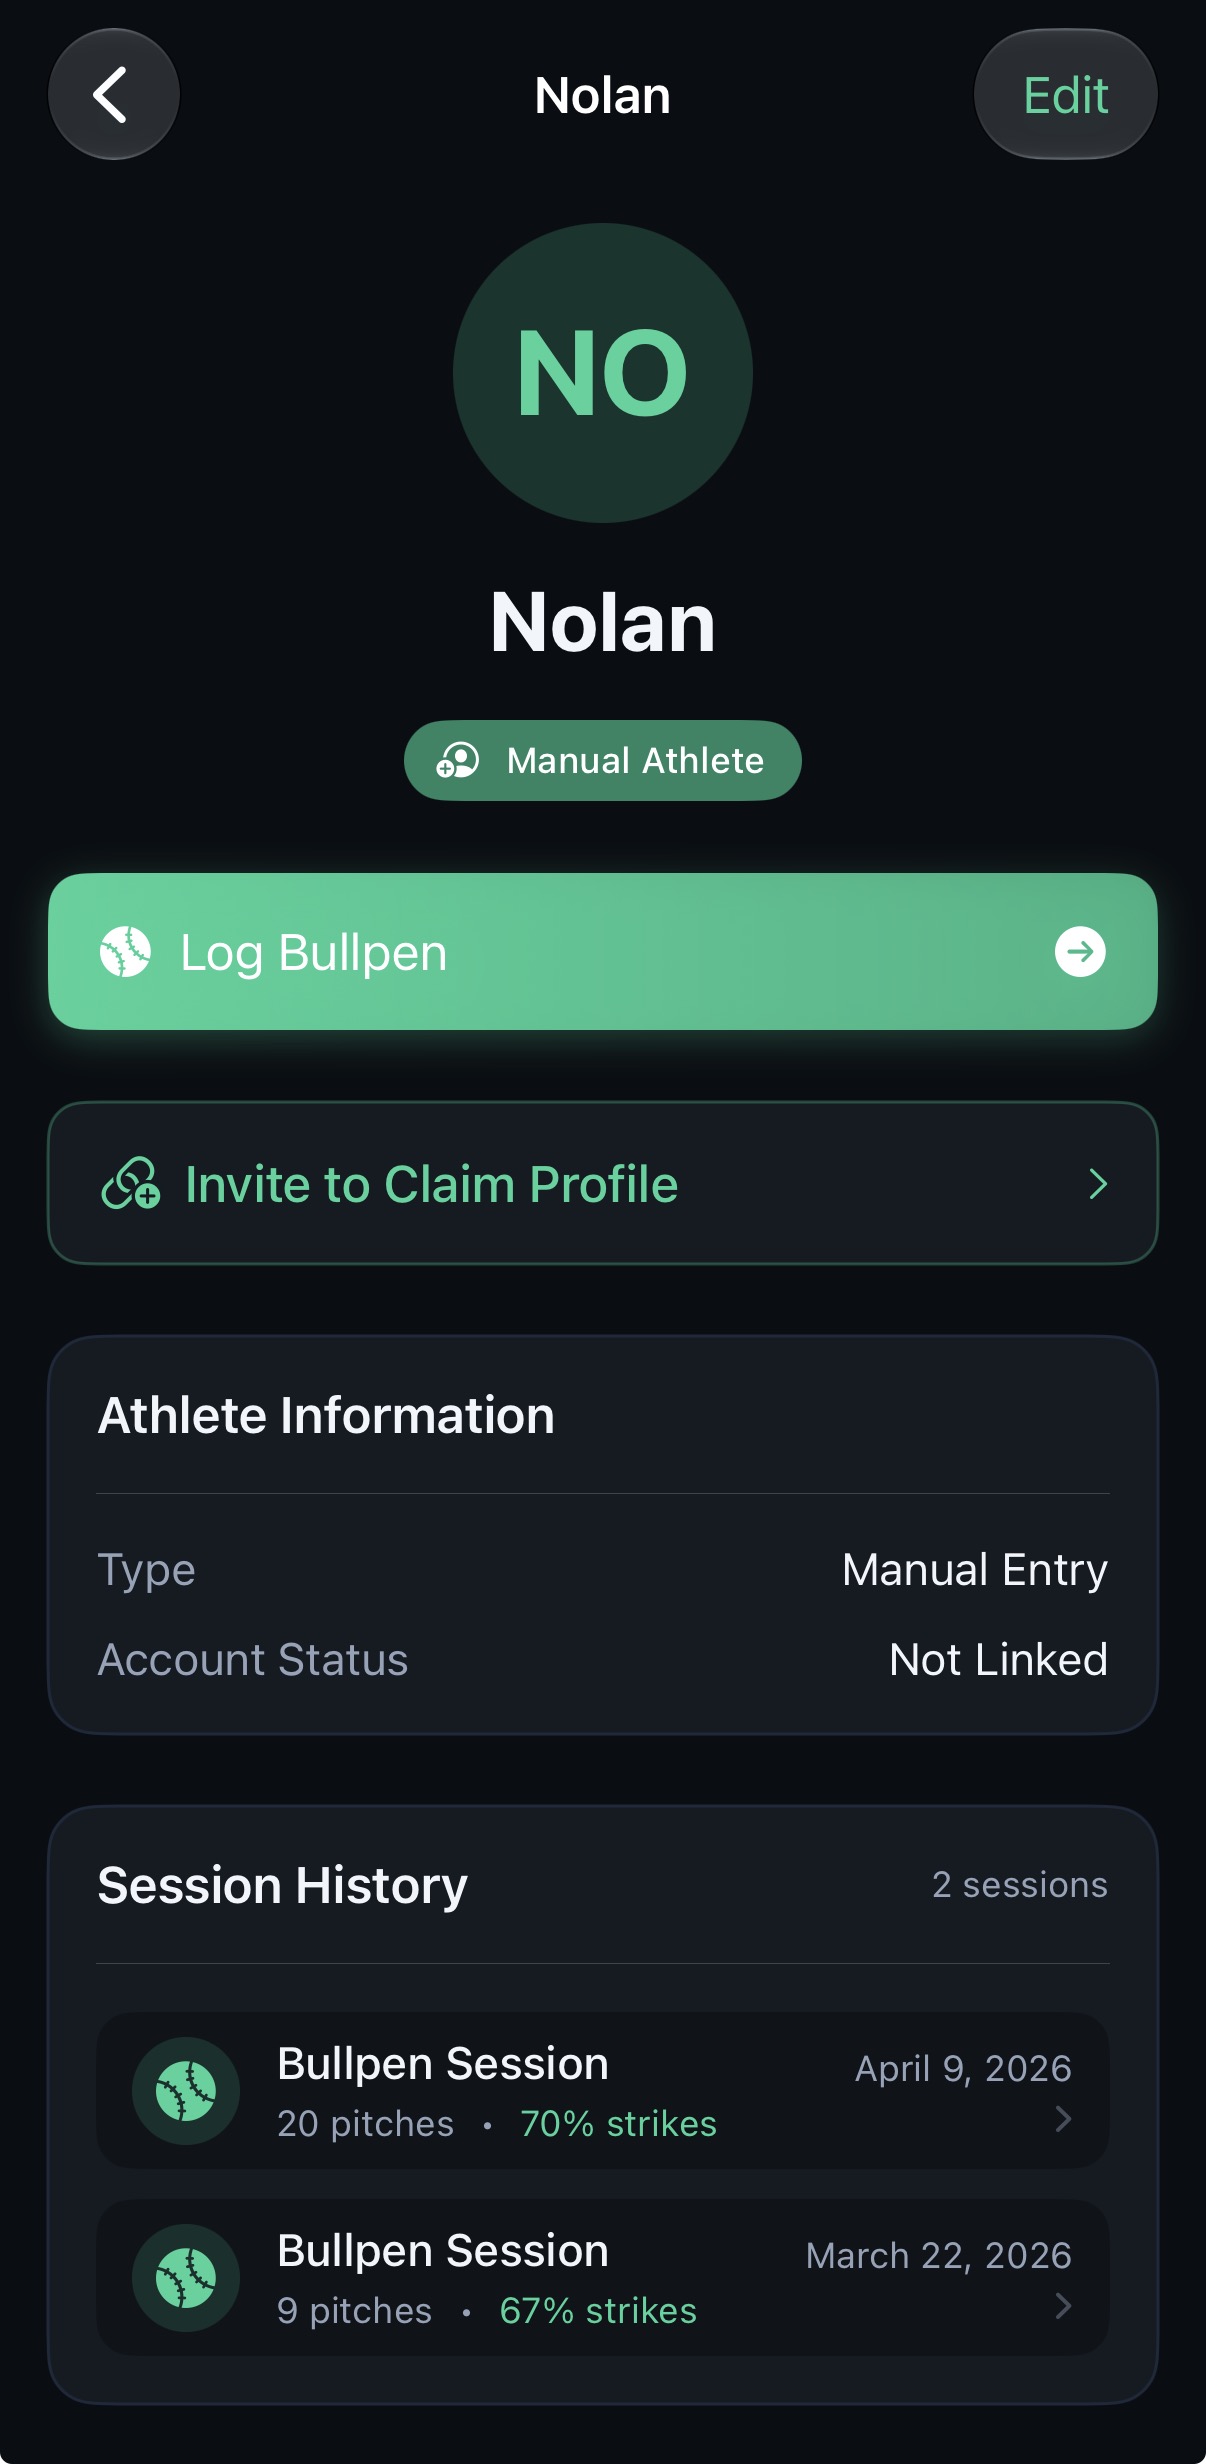
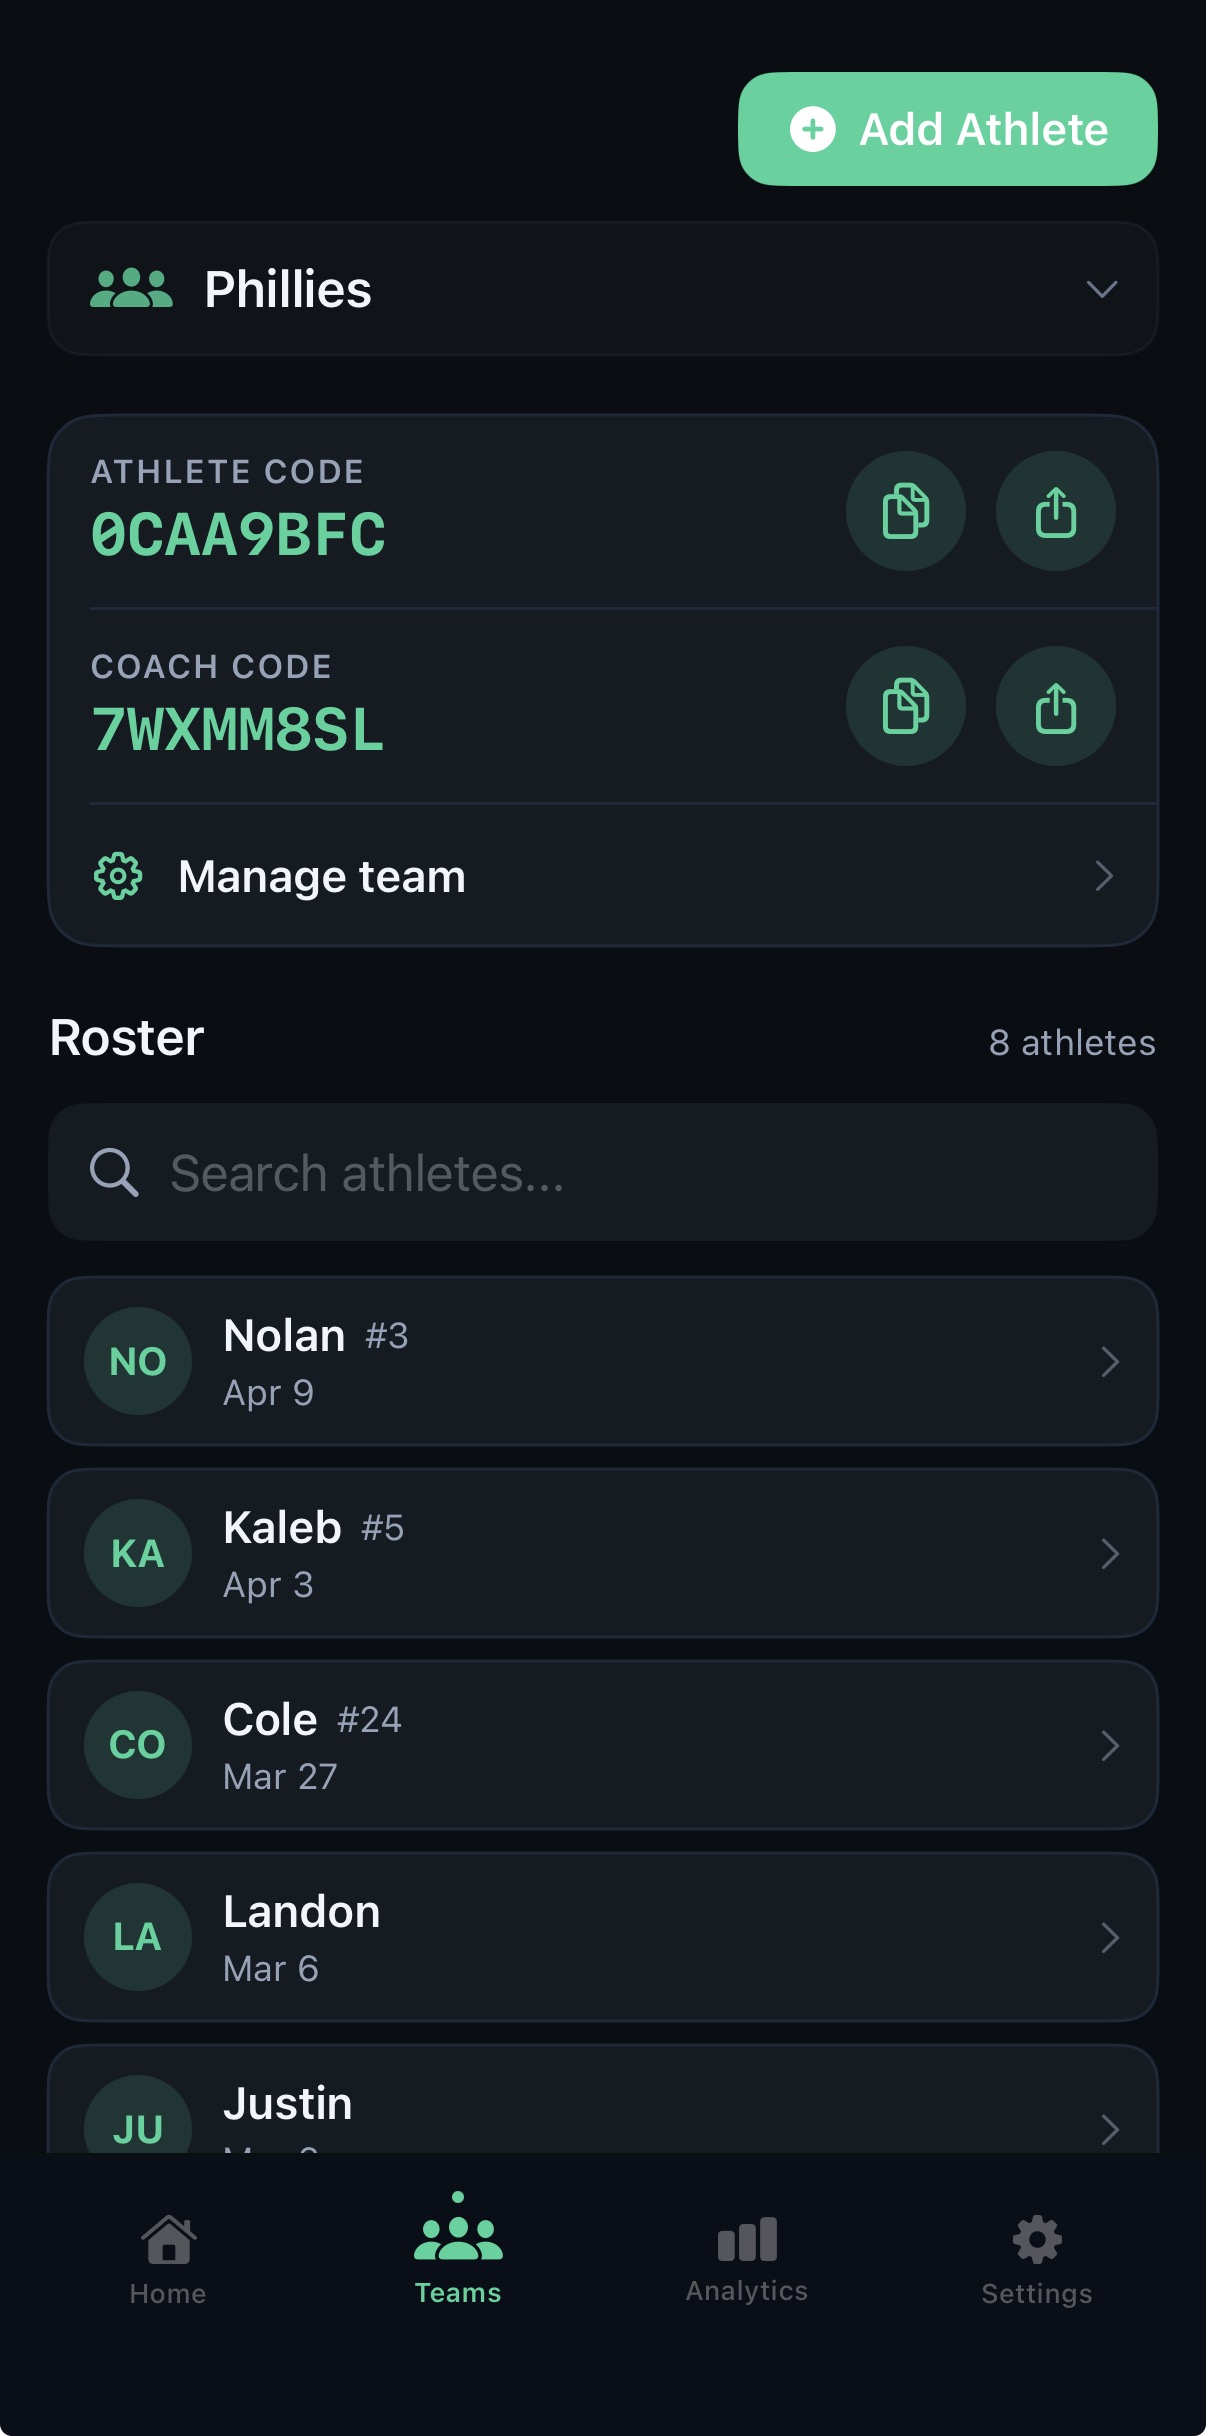
PitchWise does this on a phone at the mound. Tap where the pitch crossed, pick the pitch type, and it keeps the count. After the pen you get the summary, and over time each pitcher's trend. It works for baseball and softball, and it is free for athletes.